Reference: http://www.mssqltips.com/sqlservertip/2876/improve-sql-server-analysis-services-performance-with-the-usage-based-optimization-wizard/
Improve SQL Server Analysis Services Performance with the Usage Based Optimization Wizard
Problem
Sometimes the SQL Server Analysis Services database query performance is slow and we need to improve performance. As a first step, I am assuming you have already created a partition to improve performance. In this tip I will demonstrate how to improve the query performance using the Usage Based Optimization Wizard. Check out this tip to learn more.
Solution
In this tip we are going to use the Usage Based Optimization Wizard (UBO) to help improve performance. The UBO is a modern technique to analyze the data and propose aggregation to improve the query performance. As the image below shows, the query activity is saved to a SQL Server database, then analyzed in order to build aggregations to improve query performance.

For this tip, I am going to divide the solution into three primary sections:
- The dbo.OlapQueryLog Table Creation
- Collect data in the dbo.OlapQueryLog Table
- The SQL Server Analysis Services UBO Wizard
The dbo.OlapQueryLog Table Creation
The first step to use SSAS UBO Wizard is to configure a file or table to store the query information. In this example, we are going to create a table in the SQL Server msdb database named dbo.olapquery. It is recommended in a production environment to use a user defined database instead of a system database.
- To create the table, open SQL Server Management Studio and Connect to Analysis Server, right click on the server name and select ‘Properties’ as shown below:

- In the properties, make sure that the option ‘Log QueryLog CreateQueryLogTable’ is set to true. This option will create a table to log the data related to long queries. This information will be used to analyze and store long queries.

- In the Log QueryLog QueryConnectionString option click on the ellipsis button and a new window will be displayed, i.e. Connection Manager. In the Connection Manager window, enter the ‘Server Name’ for the SQL Server Database Engine (not the Analysis Services server name), security, database, etc. as shown below. Once this is done, restart the Analysis Services Windows service. Make sure that the Analysis Server Service Account has permissions to the database used to create the table to store the long running queries.

Once finished, you will have a table in the database selected named ‘dbo.OlapQueryLog’ as shown below.

The dbo.OlapQueryLog table contains 6 columns:
The MSOLAP_Database is the multidimensional database name e.g. AdventureWorks.
The MSOLAP_ObjectPath is the path of the object, such as a measure group. For example, if the SSAS server name is ‘myserver’, the database name is ‘adventureworksDW’, the cube name is ‘Adventure Works’ and the measure name is ‘Currency Rate’, then the object path would be: ‘myserver.adventureworksDW.Adventure Works.Currency Rate’.
The dataset column is more complex to explain, you do not really need to know what the number means because the wizard is really straightforward. The dataset column explains the use of attributes in the query. For example, if the information displayed in the dataset is 00000,000,0000,00 it shows which attributes are used in a query. 0 means that the attribute was not used in the dimension and an integer values shows the opposite. For more detailed information see the SSAS performance guide in the 3.3.1.3 Measure Query Speeds section (see the references in the Next Steps section).
The MSOLAP_User is a column that shows the user that executed the query.
The StartTime is the date that the query was executed
Finally the duration column is the time in milliseconds needed by the query to execute.
Collect Data in the dbo.OlapQueryLog Table
Once you created the table monitor the table to review the data. When customers or users query the SSAS database and the query takes long time, the information is stored in the dbo.olapquerylog table. Here is a simple query to review the data:
SELECT * FROM dbo.olapquerylog
The more SSAS queries you have the more information the table will have to suggest aggregations to improve the query response.
The UBO wizard
Once you have a representative amount of data in the dbo.olapquerylog table, you can continue with the UBO wizard as outlined below:
- In the Business Intelligence Development Studio (BIDS) or the SQL Server Data Tools, go to ‘File’ > ‘Open Project’ and select a SSAS project which is big and has slow query response time.
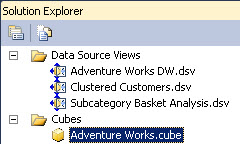
- In the SSAS project, navigate to the Solution Explorer, double click on a cube and then go to the Aggregation tab as shown below.

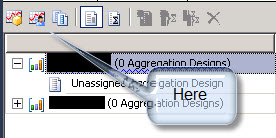
- In the Aggregation tab, click the UBO Wizard icon.
- The wizard will start with the welcome window. Press the next button to continue the wizard.

- Select the partitions used for analysis and press the next button to continue.

- The next section will show the users, the total queries and you give you the ability to filter the queries per date, per user or per frequency. For example, if you already created statistics in the past you will want to filter to an specific date. That way you will not need to analyze all the queries. Another example is to filter by users. Sometimes there are specific queries that are run just once per user in the month and creating aggregation is not urgent. In that case we can filter specific users or frequency to exclude these queries.

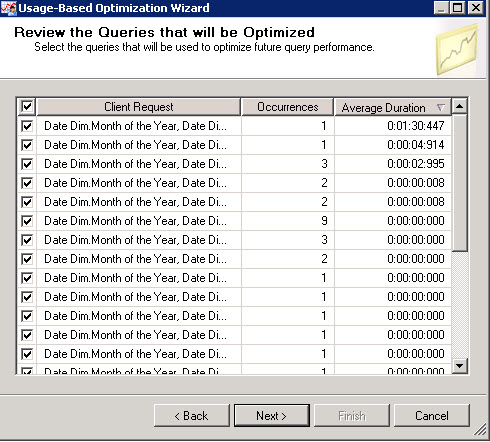
- The next interface will let you select the queries based on the number of occurrences and the average duration. You can filter and select them if you do not want to reduce the number of aggregations. As a an example, you can filter and select the queries that had the longest Average Duration.

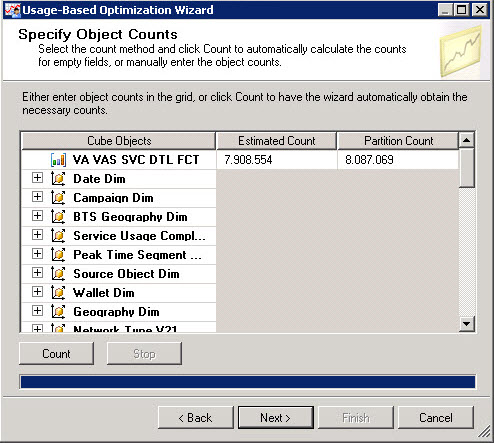
- You can press the count button or write the numbers of estimated rows and press the next button. This ‘Count’ button estimates the number of rows in the measure in order to aggregate it later.
- The aggregations can take a lot of space so you can limit the number of aggregations according to a specified number of megabytes. At the end of this steps you will find the space used per all aggregations. There are options to stop when the performance reaches 100 % or when you click the ‘Stop’ button. You can also select the option to create aggregations until it reaches 100 MB or a specific size. Once you select these options, press the ‘Start’ button to begin the process.

- You will see the number of aggregations created i.e. 20, the space used i.e. 254 MB and the optimization level which is100%. If the optimization level is 0, it means that the aggregations will not help to improve the performance.

- You can merge the new created aggregation with existing ones or create a new group of aggregations.
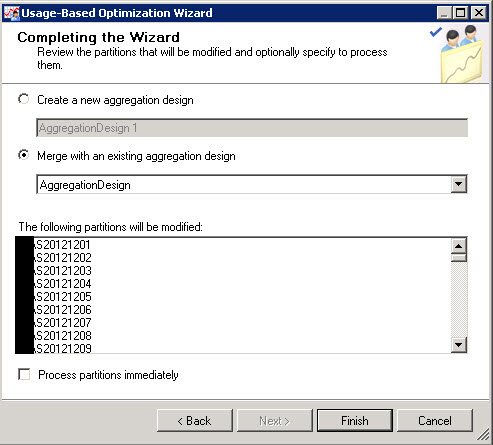
- Once done, go to ‘File’ and select the ‘Save All’ option. In the Solution Explorer right click on the cube and select the ‘Process’ option. This will load the Process Cube interface where you want to select the ‘Process Index’ for your cube.
-

-
image017
-
-
image018
Next Steps
- With these steps the query performance can improve potentially by a very large percentage. In order to test the improvements, run key queries in Analysis Services before and after running the UBO wizard and record the improvements in the response time.
- Also pay special attention to your storage while using this tool.
- The SSAS performance guide is the bible to improve the performance. You will find great information to improve performance there. For more information read the following links:
SSASPerformanceGuide2008.docx